In this post I will go through some Visual Studio 2008 tools and features I found interesting.
1. Unit Test Tool
In VS 2008, Unit Testing is facilitated through a unit test class code generator.
Unit Testing is the act of having a piece of code which only purpose is to test another piece of code, this code being part of the end product. It is a particularly tedious task, so having a unit test code generator is very handy.
A Unit Test class is used to test a class that is part of the software being built. If every classes of a software has a matching class used to unit test it, all the code will be unit tested. Unit testing is the lowest level of Quality Assurance, it does not test the software as a whole neither on its external functionalities but rather makes sure that any testable piece of code part of the software is behaving as it should.
You should consider doing Unit Testing as:
- It creates test units to check if the code is producing expected results.
- It improves code coverage. Code coverage is a number telling how many percent of the code has actually been tested. The higher value the more confident we can be in the quality of the code (as it means that a large part of the code returns expected values).
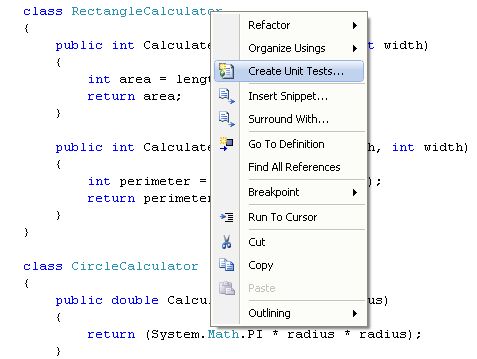
To generate a Unit Test class in VS 20008, simply right-click on any class definition and select the Create Unit Tests option to call the unit test generator tool.
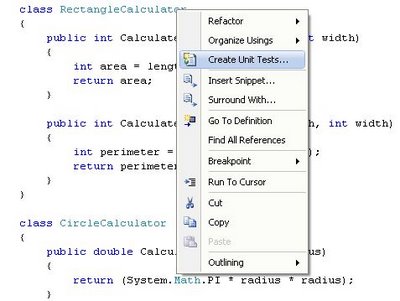
This will create a Unit Test class in a separated project dedicated for Unit Testing, this way your Unit Test code and the actual code are separated in different projects and so code is neatly kept separated.
Note that if you try to generate a Unit Test Class for a class that has private or internal modifiers, VS2008 will add a special InternalsVisibleTo attribute in your original project so that your Unit Test project (and only that one) has access to all private, internal and protected methods and classes of the original project containing the classes you want to unit test. This means that the attribute is not added at the class level but at the project level in the AssemblyInfo.cs file.
Moreover, as it can be seen hereunder, only the Unit Test project (here called CalculatorTest) will have access to internal classes and methods:
[assembly: System.Runtime.CompilerServices.InternalsVisibleTo(“CalculatorTest”)]
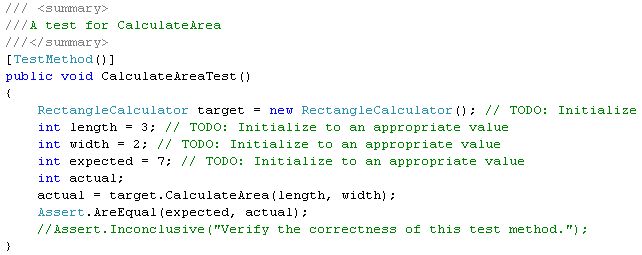
Once the Unit Test classes are generated, you will have to go into them, inspect the code and set input values that will be used to call the methods that need to be tested and also set the expected result value that should be returned by the method. This way, the actual value returned can be compared with the expected value to decide if the test was conclusive or not. There are TODO sections declared in the generated code so that you can easily locate where to set test values.
In the example hereunder, values are set for the length and width of the rectangle and the variable expected contains the pre-calculated area of the rectangle so that we can check if the output of the method is equal to what should be returned. If the value returned by the method is not what is expected, that means that the unit test fail and that there is a bug in the tested method. Visual Studio will clearly show in the test results what unit test succeeded or failed.
Lastly, do not forget to comment out the Assert.Inconclusive() method call.

The Test project creates a vsmdi file in the solution item folder, named after the solution name, Calculator.vsdmi for a Visual Studio solution called Calculator.
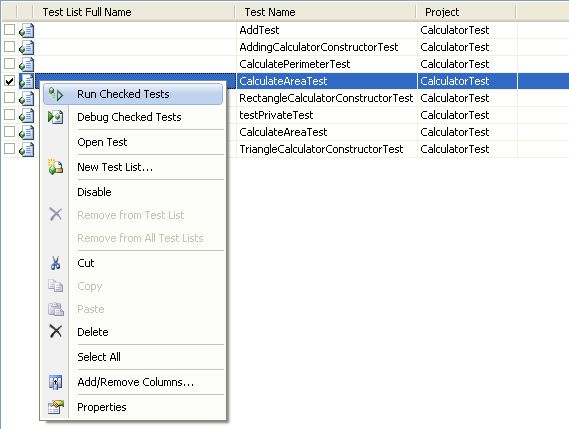
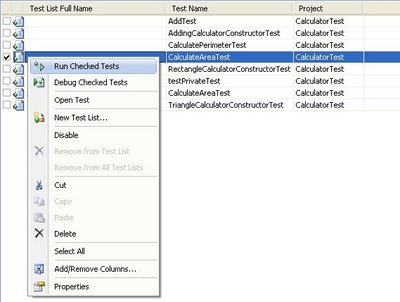
To actually test some or all the unit test methods, open the vsdmi file, select the methods that you want to test, right-click on the list of methods and select Run Checked Tests.
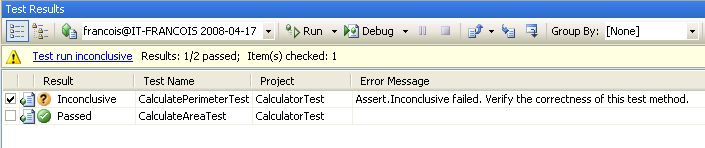
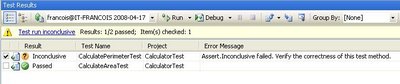
Once the test ran, the result will be displayed showing if the test succeeded, failed or was inconclusive.
2. Object Test Bench
If you do not have the time to create full blown Unit Test but still want to test some of your classes and/or methods, there is a quick and dirty way to do it by using the Object Test Bench tool. The tool can call static methods on classes and create object instances of classes so that instance methods can be called ad-hoc. Methods can thus be tested very simply, in a similar way as when you chose to execute a Stored Procedure in SQL Server Management Studio and that a window pops up to let you input the SP parameters.
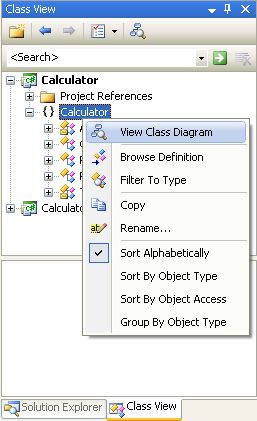
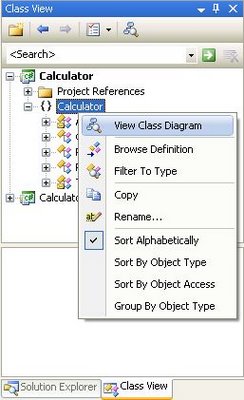
To use the Object Test Bench, you need first to create Class Diagram of your project. To do so, click on the Class View of your Visual Studio project, select the root namespace of your project, right-click on it and choose the View Class Diagram option.
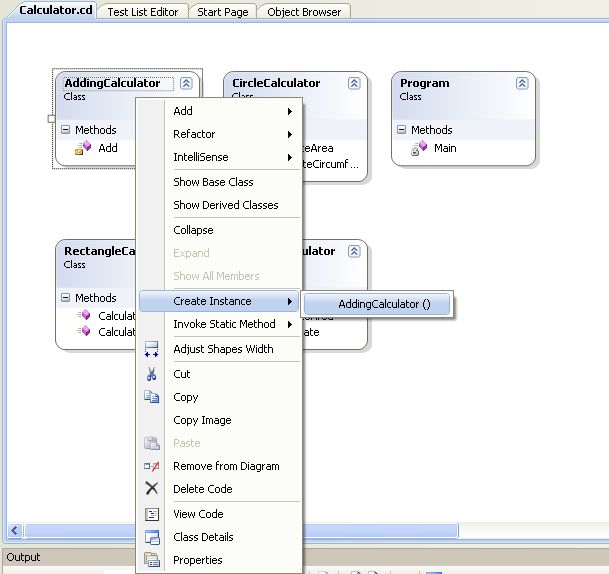
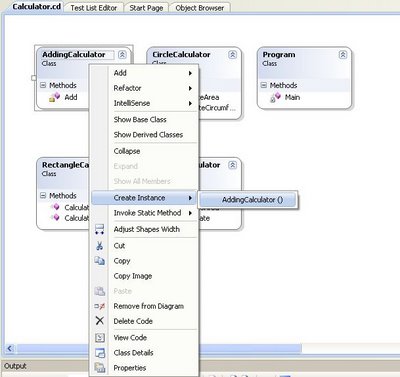
Once the class diagram is created you can call the Object Test Bench tool by either calling a static method on the class or one of the class constructor so that you will be able to call an instance methods after the object is instanciated.
In my case I want to test the Add() method to check if my Calculator object correctly adds numbers. To do so I first instanciate a Calculator object which opens the Object Test Bench window under the class diagram. After the object is created in memory and appears in the Object Test Bench window, I can chose to call any method of the object. I will thus dynamically call the Add() method through the Visual Studio IDE and check if the method returns a correct result.
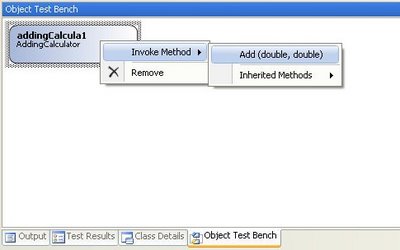
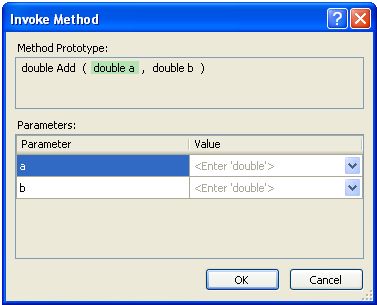
A window will pop up so that you can give values to the input parameters.

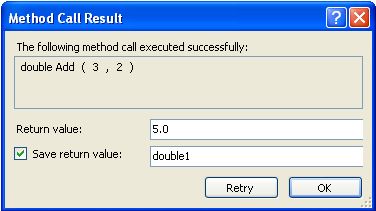
Once the parameters are entered and you click on OK, a pop up window will display the result. You can choose to save the result in a variable so that you can re-use it later. For example you could re-use the variable as a parameter to call another method that you want to test-bench. This way, in a few clicks, you can create a bunch of objects and then re-use them later to call methods that take complex-type objects as parameter.
3. Generate Method Stub (only for C#)
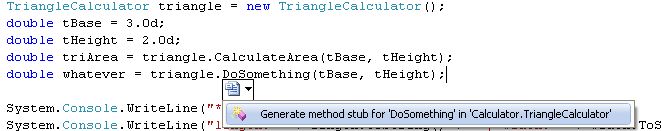
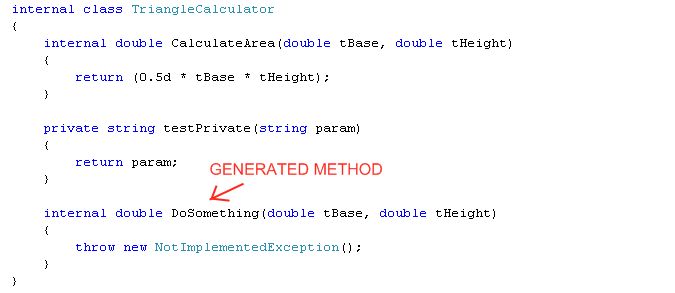
It is a code generation feature that creates methods before they exist; the method created is based on the call to that method. Once the call to the method is made, Visual Studio 2008 IntelliSense will give you the option to generate a method stub matching the call to that method, with the matching input parameters and return type.
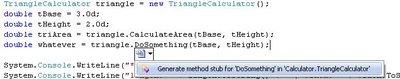
The generated method will be created in the matching class and its stub implementation will simply throw a NotImplementedException.
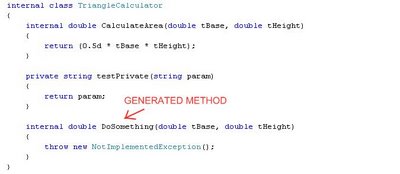
Note that this code generation feature is only available for C#.
4. Refactoring Tools (C# only)
Refactoring is making changes to a body of code in order to improve its internal structure without changing its external behavior.
– Martin Fowler
It is useful concept to make code cleaner and more understandable/readable.
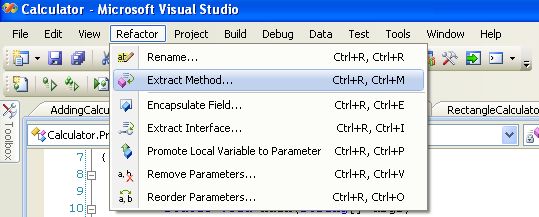
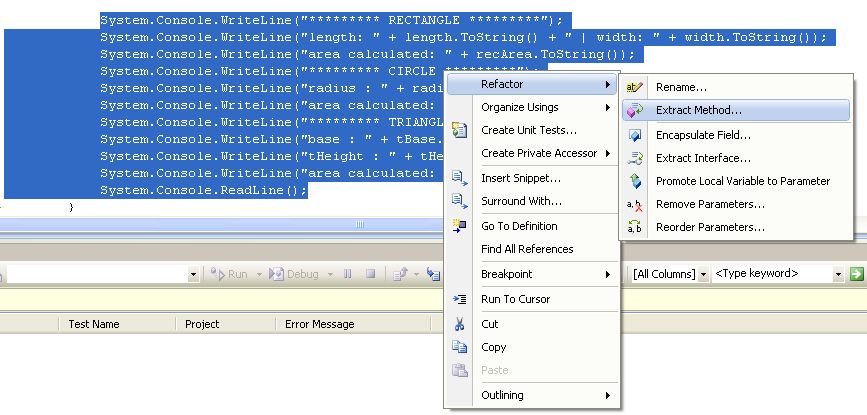
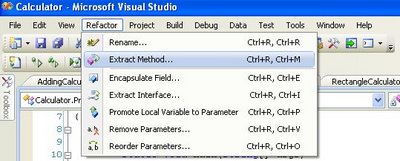
A typical refactoring case is to break up a lengthy method into separate methods. To do so, you can highlight a piece of a code, right-click on it (or go to the Refactor menu of Visual Studio) and choose Extract Method. This will generate a method containing the highlighted code as well as calling the generated method from the original location.
Refactor menu in Visual Studio 2008:
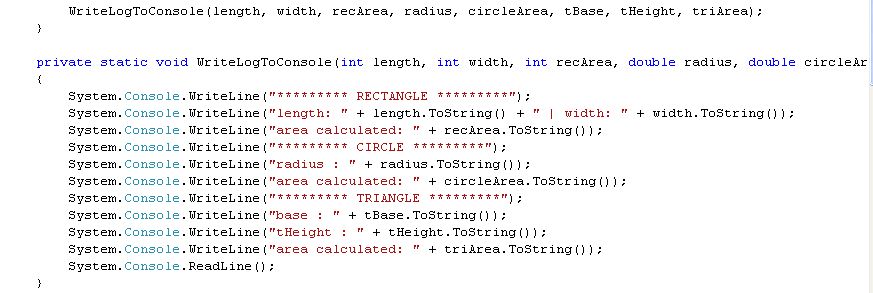
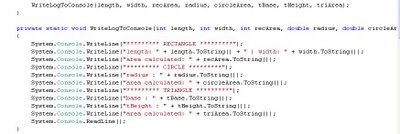
Refactoring code by creating a method to shorten the original code, it is the action of extracting a method from a piece of code.
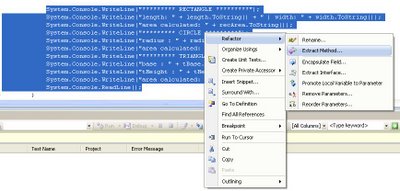
The example here above will create a method containing the highlighted code and replace the original code by a call to the generated method (which I called WriteLogToConsole):
5. The .Net Framework Source Code
It is possible to go through the source code of the .Net Framework while debugging. Here are the steps I did to make it work:
1. Install the hotfix KB 944899 – Visual Studio 2008 performance decreases when you step through source code that you downloaded from Reference Source Server.
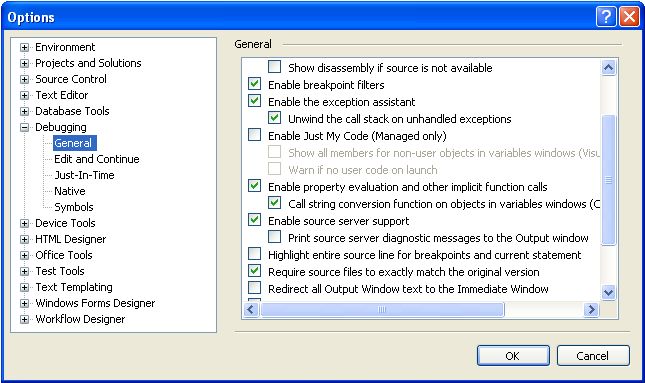
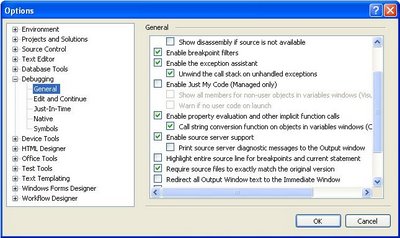
2.Configure Visual Studio debugger to be able to step in the .Net Framework Source Code:
- Uncheck Enable Just My Code (Managed only).
- Check Enable source server support.
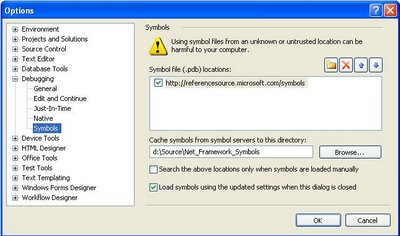
3.Configure the Symbols part of the Visual Studio debugger options so that Visual Studio know where to download the .Net Framework debugging symbol (.pdb files) and source code.
- Set the Symbol file (.pdb) location to be: http://referencesource.microsoft.com/symbols
- Set a Cache location folder where the .Net Framework pdb and source code files will be stored. Make sure it is a location that your account has read/write access to. For example, a folder under your user hive.
- Clear the Search the above locations only when symbols are loaded manually if you want that Visual Studio automatically download symbols and source code while you step in .Net Framework code (F11 shortcut key). Note that if your project is big and references many libraries, downloading all the debugging symbols will be slow at the first debug. If you prefer to load symbols only when needed, keep that box checked. You will then have to download debugging symbols and source code on demand by right-clicking the appropriate dll in the stacktrace and choose Load Symbol.
Here is how I configured my Visual Studio:
Visual Studio 2008 is now all set to debug and step in .Net Framework Source Code!
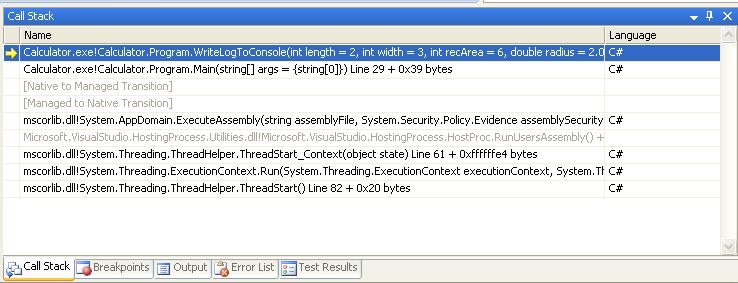
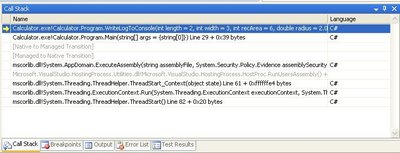
While debugging, we can now see that the debugger call stack contains detailed file and line number information for the .NET Framework classes and methods:
Example of use:
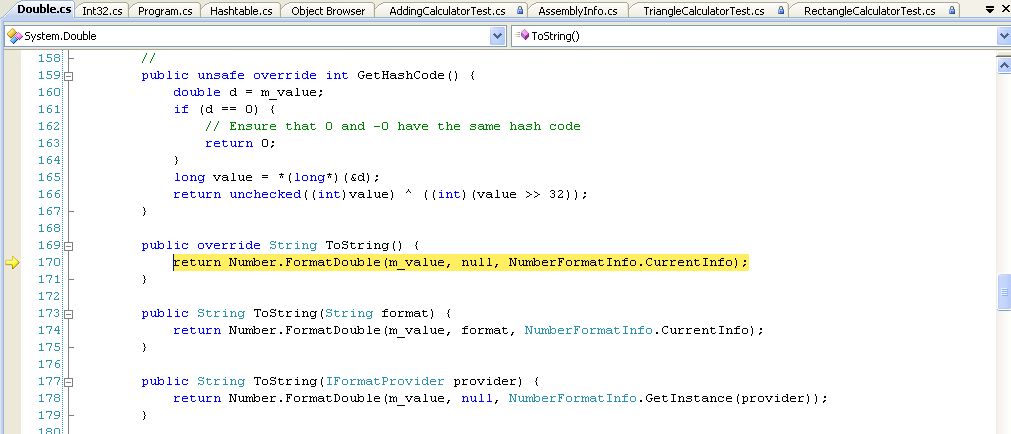
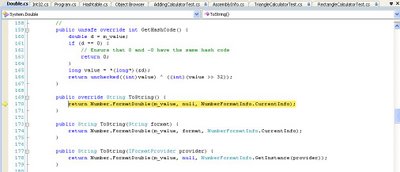
In the following screenshot, I stepped in a line of code that calls the ToString() method on a Double type, this makes that the mscorlib pdb file is downloaded as well as the source code for the Double structure so that I can actually debug into the Double type and see its implementation as written by the .Net team. That is something I find really cool and I think has been missing for a long time!
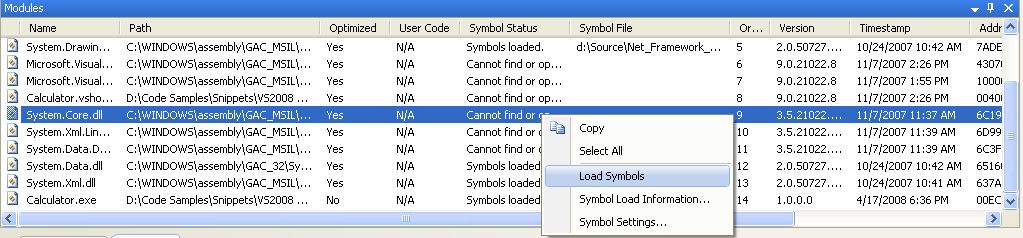
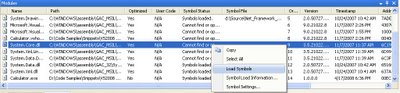
Modules Window:
While you are debugging, you can bring up the Modules Wwndow by hitting the ALT+CTRL+U keys. This window shows all the dll loaded by the debugger and let you see which dll has debug information loaded and which does not. You can manually load debugging symbols from that window by right clicking on the library you want to load the symbols for and select the Load Symbols option.
List of assemblies currently available at the time of writing for symbol/source loading:
- Mscorlib.dll
- System.dll
- System.Data.dll
- System.Drawing.dll
- System.Web.dll
- System.Web.Extensions.dll
- System.Windows.Forms.dll
- System.XML.dll
- WPF (UIAutomation*.dll, System.Windows.dll, System.Printing.dll, System.Speech.dll, WindowsBase.dll, WindowsFormsIntegration.dll, Presentation*.dll, some others)
- Microsoft.VisualBasic.dll
For reference, here is a lengthier blog post by Shawn Burke with more information regarding .Net Framework Source Code debugging.
6. SQL Metal
SQL Metal is used to help implementing LINQ to SQL scenarios. It is a command-line utility (sqlmetal.exe).
SQL Metal can:
- Generate source code and mapping attributes or a mapping file from a database.
- Generate an intermediate database markup language file (.dbml) for customization from a database.
- Generate code and mapping attributes or a mapping file from a .dbml file.
What is a mapping file?
A mapping file is an XML file to specify mapping between the data model of the database and the object model of the .Net code. It keeps the mapping code out of the application code which helps in keeping the code cleaner and leaner. Moreover, since it is XML (like any other .config file) it can be changed without having to rebuild the application code.
Check out MSDN documentation for more information about SQLMetal.
7. Visual Studio 2008 Product Comparison
Great comparison between the different functionalities available on each edition of Visual Studio 2008: http://www.microsoft.com/en-us/download/details.aspx?id=7940